MiHyun Kim
Associate Professor
Texas State University
Have you ever wondered whether you’re being fairly compensated for your work? Have you experienced frustration due to an unfair salary structure? Do you question if factors like your gender, race, or connections to higher-level administrators play a role in this inequitable environment?
This study explores the persistent challenges of salary compression and inversion across various fields in higher education, with a specific focus on the discipline of art and design. Institutions often face the need to attract new talent with specialized skills, resulting in higher starting salaries for new hires and creating disparities among existing faculty members.
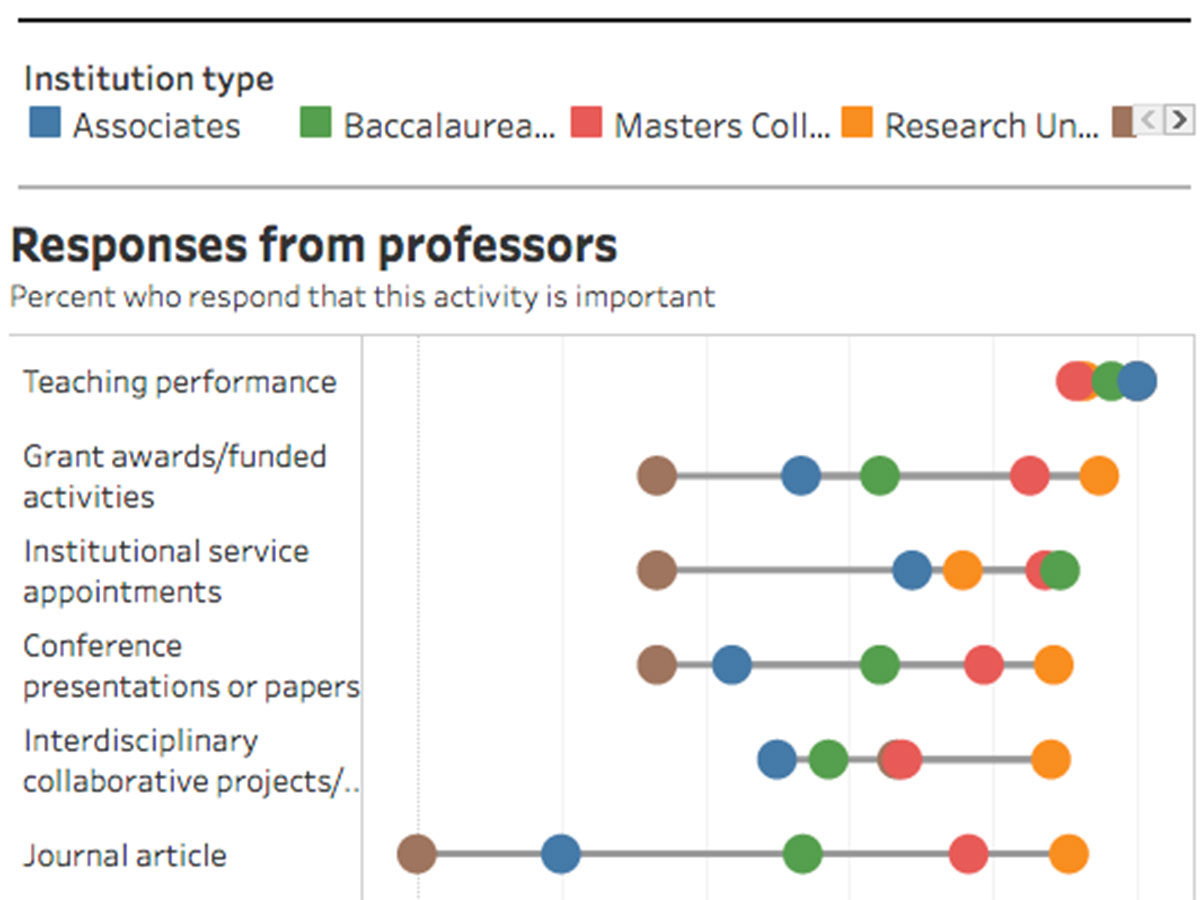
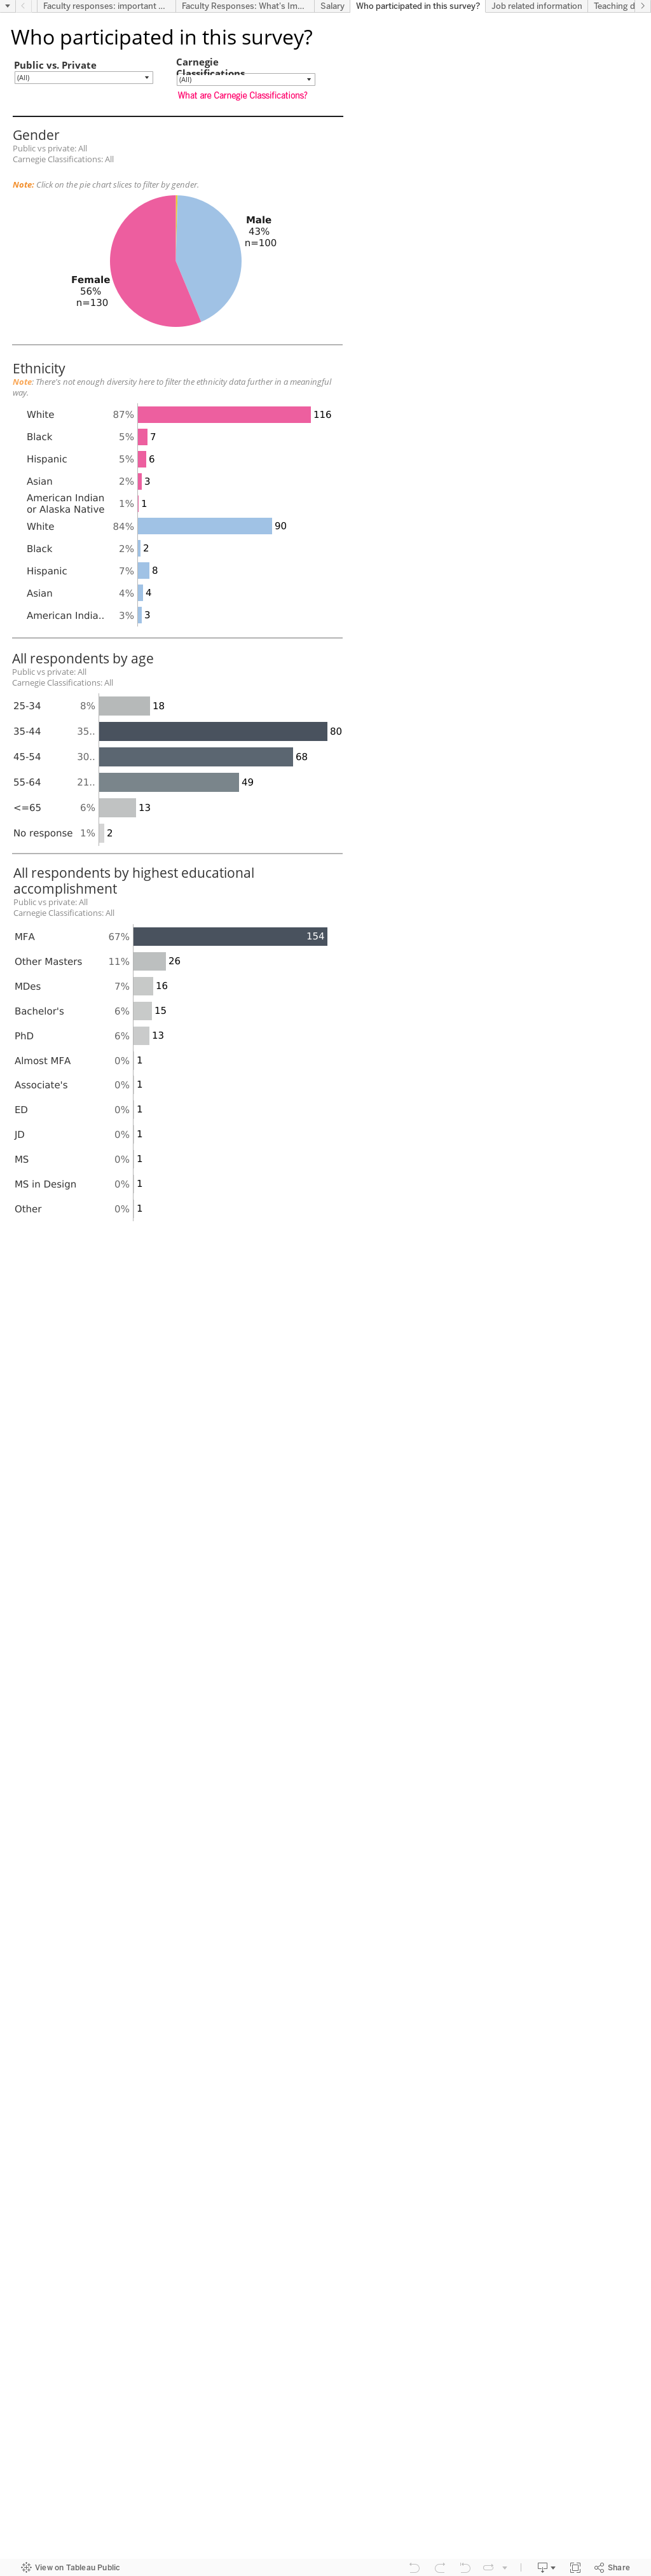
As a Faculty Senate Fellow at Texas State University during the 2022-2023 academic year, I developed a series of compelling data visualizations based on regional and national salary compression data sourced from institutional data and the College and University Professional Association for Human Resources (CUPA). The study found that as of the 2022—2023 academic year, 51.8% of the faculty at Texas State University earned below the national median salary and 46.8% of the faculty at the School of Art and Design earned below the national median salary.
By examining salaries across different colleges, departments, and ranks, I aimed to identify trends and patterns in compensation, comparing state universities in Texas and peer institutions across the nation. Also, I pinpointed faculty members earning below the national median salaries, highlighting disparities, especially among senior lecturers, minorities, and full professors. As a result of the study, the university increased the salaries of faculty members whose incomes were below 90% of the national median salary.
To investigate the topic deeper from various perspectives, a salary sub-committee among the faculty senates was formed, and a survey was conducted to gather information and insights from faculty members regarding salary compression issues at the university. The responses were categorized into five groups, and these categories were visualized to encourage empathy and understanding among faculty members and upper-level administrators.
The ultimate goal of this project is to advocate for fair and equitable compensation practices, empowering faculty with data-driven information to establish a transparent salary structure. This presentation explores the visualized data, gains a deeper understanding of salary equity challenges, and contributes to the conversation on reshaping compensation practices within higher education.
This design research is presented at Design Incubation Colloquium 11.1: Boston University on Friday, October 25, 2024.