Ann McDonald
Associate Professor
Northeastern University
This presentation will provide critical visual analysis of various methods currently used for mapping emotions over time in experience maps and point to possible alternate methods. The intent is to challenge designers and researchers to examine the value of more meaningful data collection and visual synthesis of the emotional component or the ‘feeling’ aspect of the typical ‘thinking, feeling, doing’ channels represented in experience maps. (1)
Experience maps are timelines or chronologies created to help understand complex, abstract interactions that occur over time in the context of a customer or user achieving a goal or meeting a need. Design teams use experience and customer journey mapping and storyboard templates (2, 3) as a means to collect, analyze, and visually synthesize research observations of user experiences. These maps aid in the understanding of existing conditions, help identify pain points, and foster consensus about how to improve product and service offerings.
Mapping experiences is one of the multiple methods used to foster empathy in designers and collaborators. We develop understanding and empathy through interviews, observation, and the willingness to take time to discover the internal thoughts and reactions that drive others. A key element of experience mapping is representing changes in emotions over time. But temporal emotions are often simplified to a y-axis mapping of the intensity of vaguely identified emotions across an x-axis of phases over time. Emoticons and color are often added to define changes in positive and negative emotions. Conventions from literature also inform these models based on highs and lows of story arcs over narrative time.
We need to ensure there is adequate data collected by design research teams so we can meaningfully represent changes in emotional states. As humans, we readily pay attention to physical changes in the face, voice, and body as a means for expressing emotions. But understanding another’s cognitive and emotional states takes time and training in observation and interview techniques. Experience maps are often a synthesis of multiple individuals’ journeys and represent the experience of a persona–a summary user archetype crafted from research on multiple individuals in order to represent varied user types.
Some concerns found with personas development and use—they can be biased by their creators, based on insufficient or non-representative data, or used to justify preconceptions—may also follow as concerns for emotion mapping. (4) If we openly question experience mapping templates and assumptions, what alternate visual models of understanding experience and temporal emotions can evolve? What can be learned from other temporal representation models and fields to enrich research synthesis and visualization connecting storytelling (qualitative) and data (quantitative) to increase understanding and envisioning? How can we better use the power of information design to explain events and expose narratives, patterns, emotional responses, and relationships across time? How can we be more mindful of any culturally specific connotations of color and emotional response?
As information designers, we have an opportunity to create alternative models to communicate emotions and relations and connect multiple scales and time frames. Design teams could benefit from the use of more rigorous methods to offer nuanced representations of complex experiences that occur over both micro and macro time frames. This work is part of a broader investigation of notational systems and historical and innovative mapping as scores of experiences across multiple fields such as music, dance, performance, improvisation, urban planning, sports, etc.
1 Adaptive Path’s A guide to Experience Mapping, 2013.
2 Kalbach, James. Mapping Experiences: A Complete Guide to Creating Value through Journeys, Blueprints, and Diagrams. O’Reilly Media, 2016.
3 Lupton, Ellen. Design Is Storytelling. Smithsonian Design Museum, 2017.
4 Salminen, J., Jansen, J., An, J., Kwak, H., & Jung, S. (2018). Are personas done? Evaluating their usefulness in the age of digital analytics. Persona Studies, 4, 47.
Barrett, L. F. (2012). Emotions are real. Emotion, 12(3), 413–429.
McCloud, S. (1994). Understanding Comics. Harper Collins.
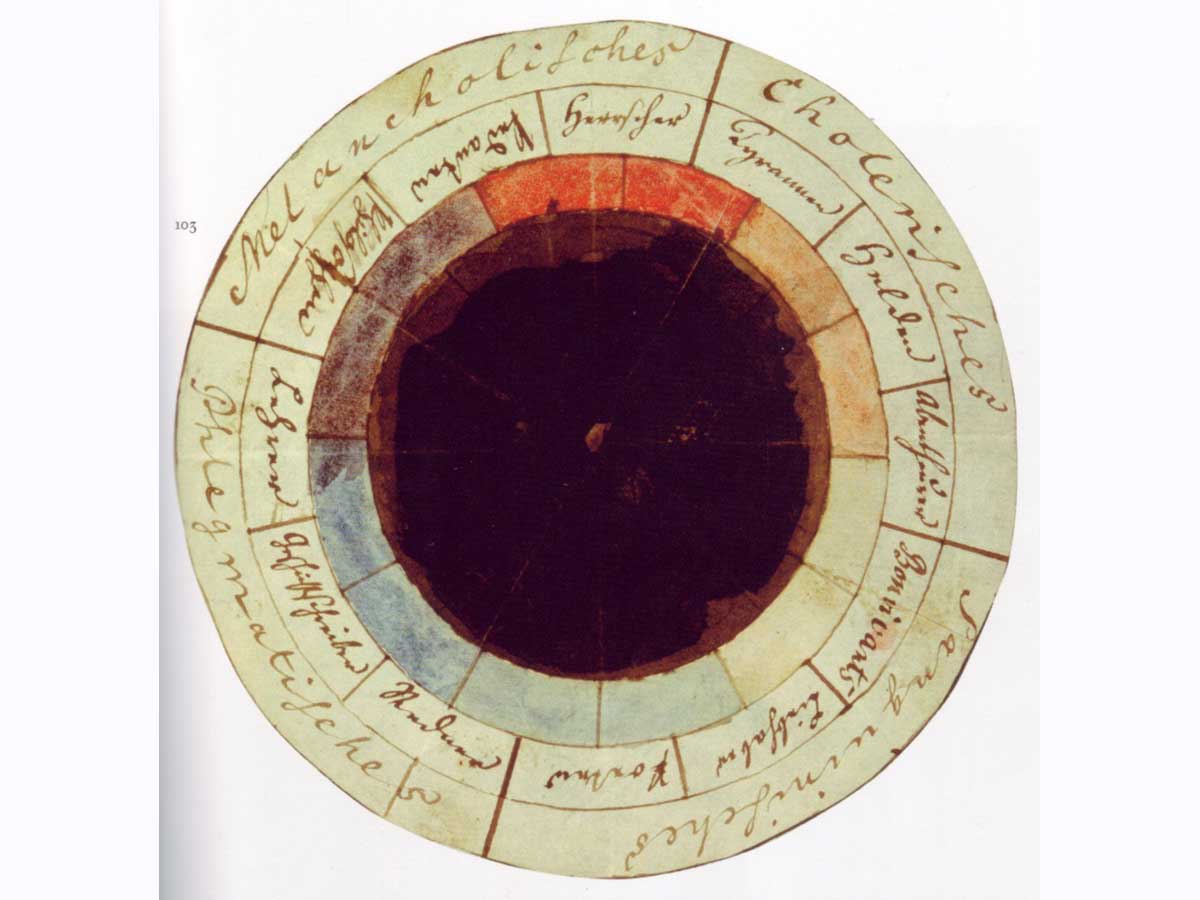
Rodrigues, D., Prada, M., Gaspar, R., Garrido, M. V., & Lopes, D. (2018). Lisbon Emoji and Emoticon Database (LEED): Norms for emoji and emoticons in seven evaluative dimensions. Behavior Research Methods, 50(1), 392–405. image: The “rose of temperaments” (Temperamenten-Rose) compiled by Goethe and Schiller in 1798/9. https://en.wikipedia.org/wiki/Color_psychology#/media/File:Goethe_Schiller_Die_Temperamentenrose.jpg
This research was presented at the Design Incubation Colloquium 6.2: CAA 2020 Conference Chicago on February 14, 2020.
